51Trips

2022

How I tested the biggest funnel problem without code

The biggest drop-off was trip documentation. With no dev resources, I designed an AI-assisted solution and validated it with real users before writing code. We proved the concept and shaped the roadmap.

The biggest drop-off was trip documentation. With no dev resources, I designed an AI-assisted solution and validated it with real users before writing code. We proved the concept and shaped the roadmap.

Role

UX/UI Designer

Sole Designer

Team

1x Product Manager

1x Engineer

About

51Trips is a travel tech company that transforms travel photos into personalized physical albums using AI while committing to sustainability by donating a percentage of sales to conservation projects.

Role

UX/UI Designer

Sole Designer

Team

1x Product Manager

1x Engineer

About

51Trips is a travel tech company that transforms travel photos into personalized physical albums using AI while committing to sustainability by donating a percentage of sales to conservation projects.

Role

UX/UI Designer

Sole Designer

Team

1x Product Manager

1x Engineer

About

51Trips is a travel tech company that transforms travel photos into personalized physical albums using AI while committing to sustainability by donating a percentage of sales to conservation projects.

Problem area

A metric that worried investors

Users wanted to document their trips and turn them into something they could keep. But documenting each day was slow, manual, and repetitive. Each day left undocumented made the pending work feel bigger, until giving up felt easier than finishing. Low completion rates meant the main product couldn't sell, acquisition costs had no return, and funnel numbers didn't meet expectations.

Starting point

Her incorporation brought very interesting dynamics at the UX level, always with a strategic perspective and involving the entire team. She's a natural researcher, passionate about diving deep into any area. Creative, cheerful, and always willing to lend a hand. Without a doubt, a great colleague and professional.

Design decision 01

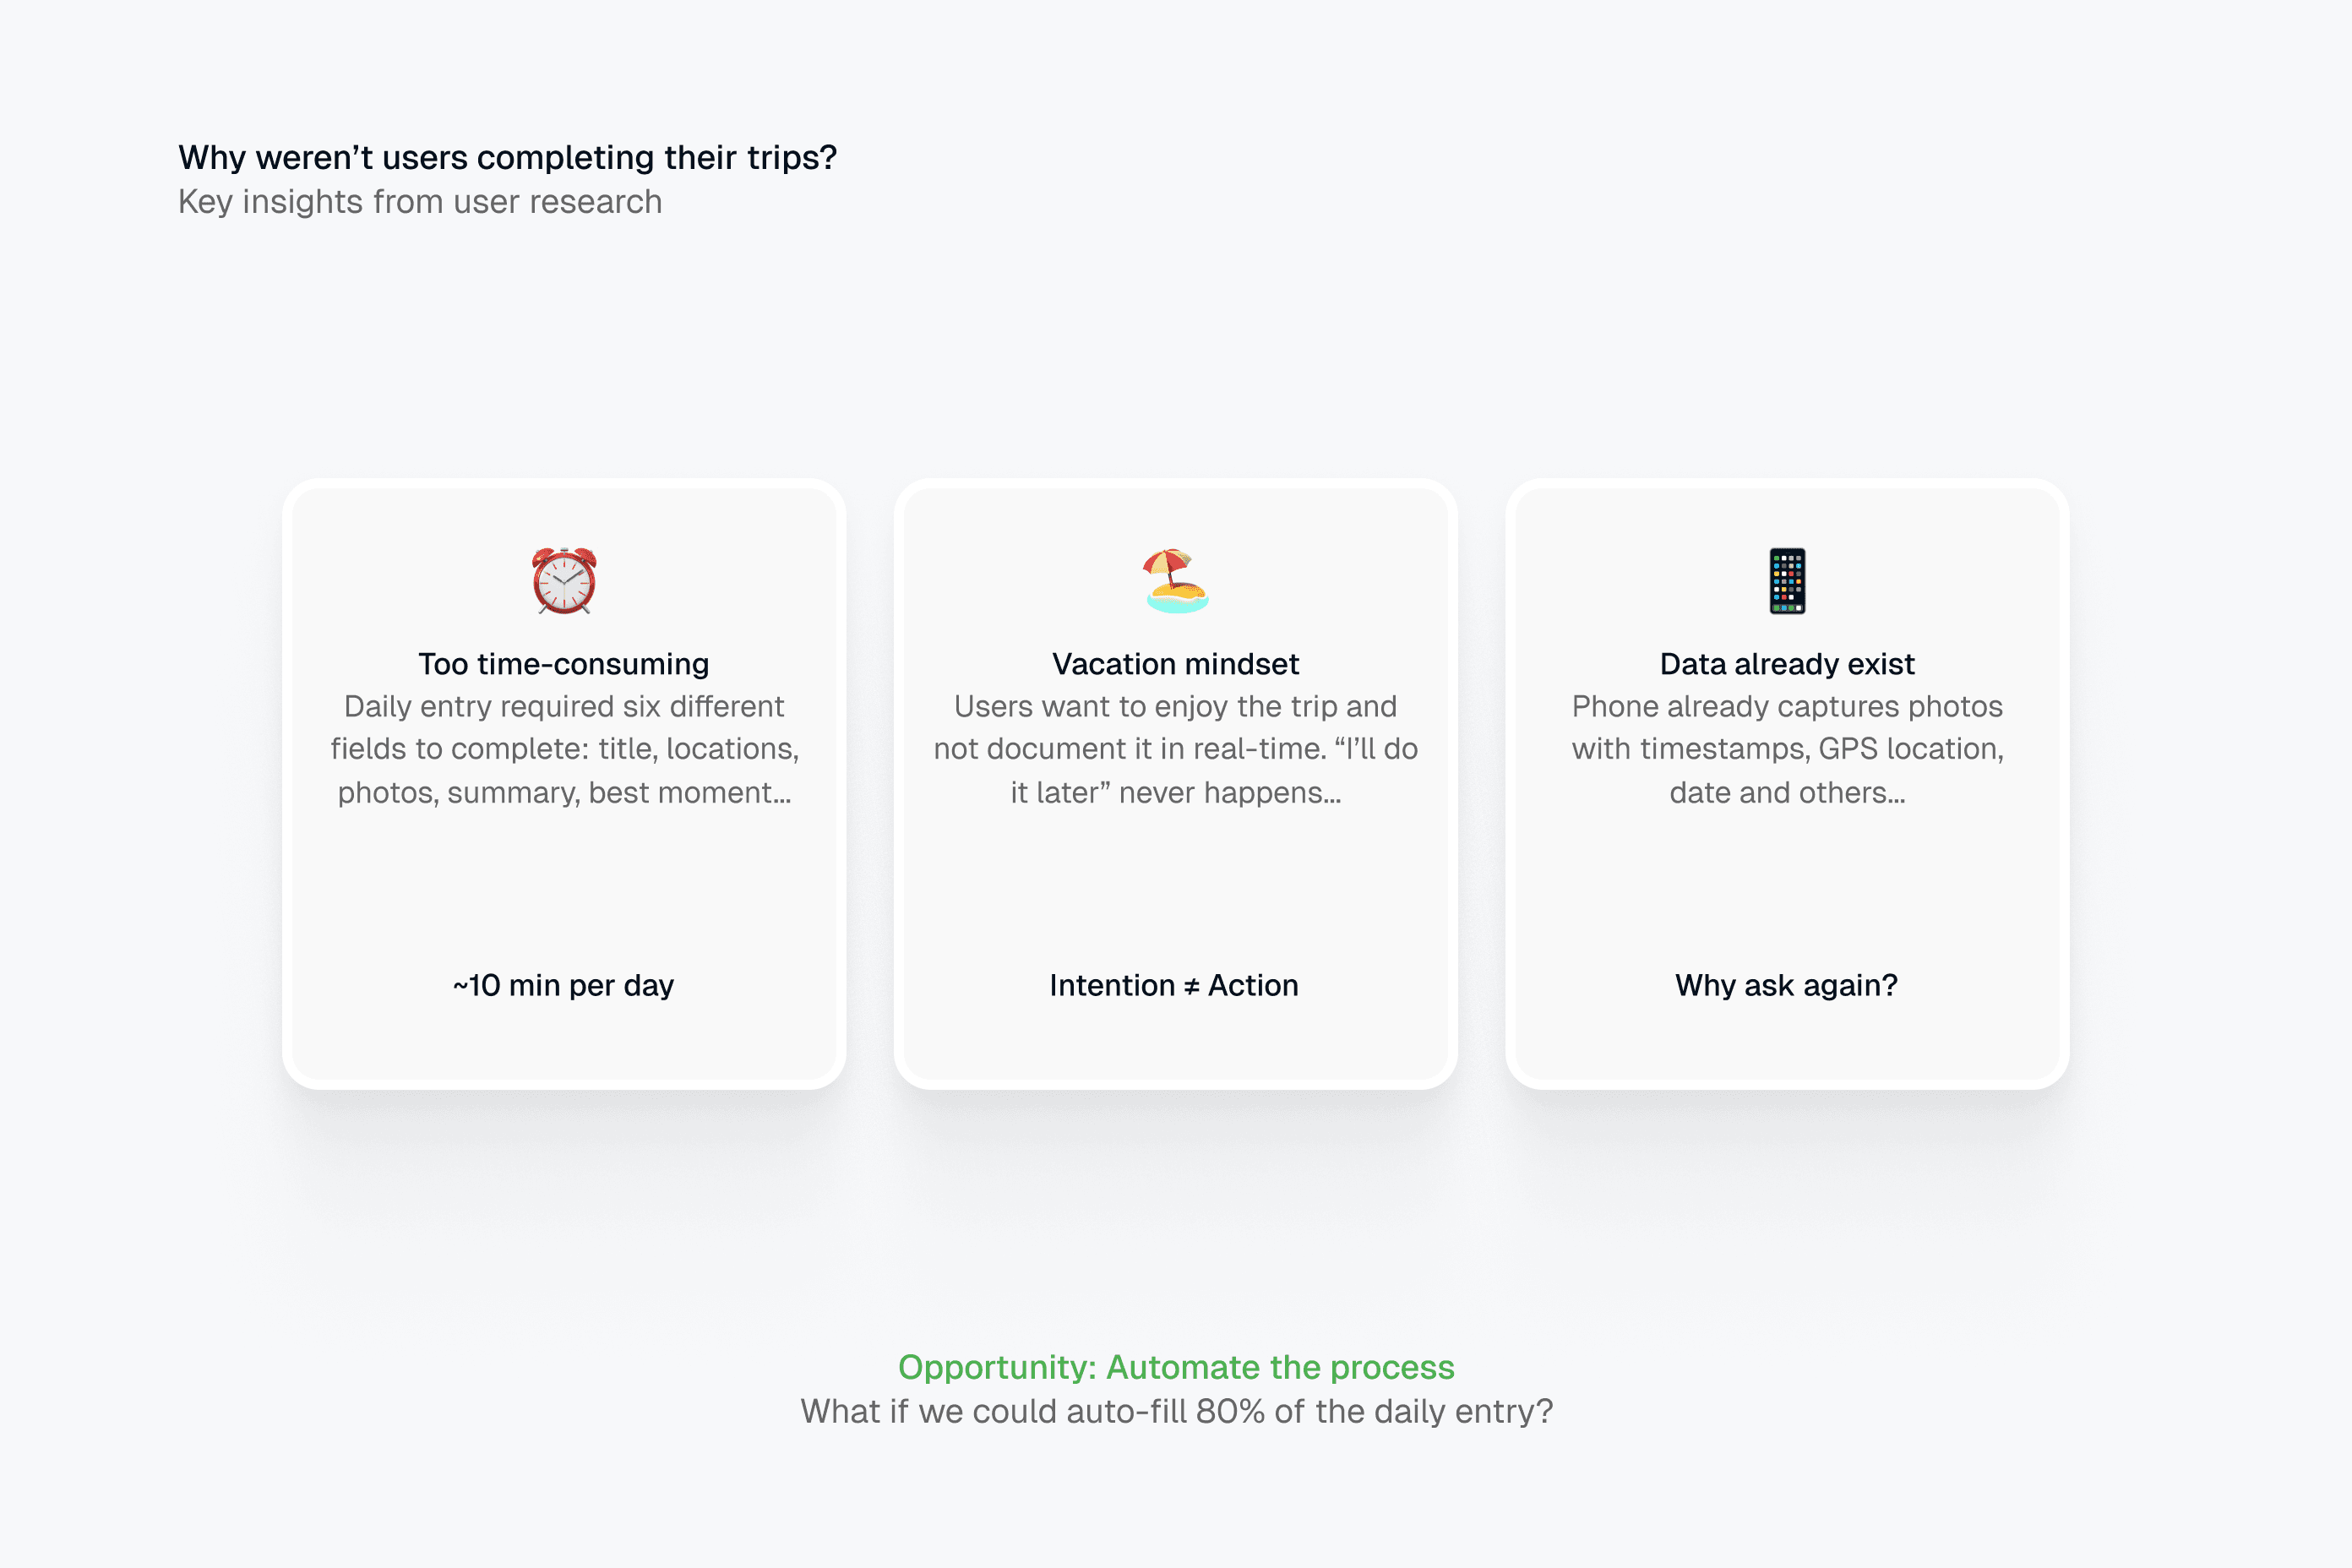
Why weren’t users completing their trips?

Without resources for extensive research, we used old survey responses, user journeys, and generative interviews to build hypotheses about what was blocking users in the funnel. The data clearly showed that users didn't have time and the process was too tedious, especially for someone traveling or back to their daily routine. Only highly committed users were completing their trips, but the business needed to reach more people to increase sales.

Understanding the problem
Design decision 02

An intuition worth testing

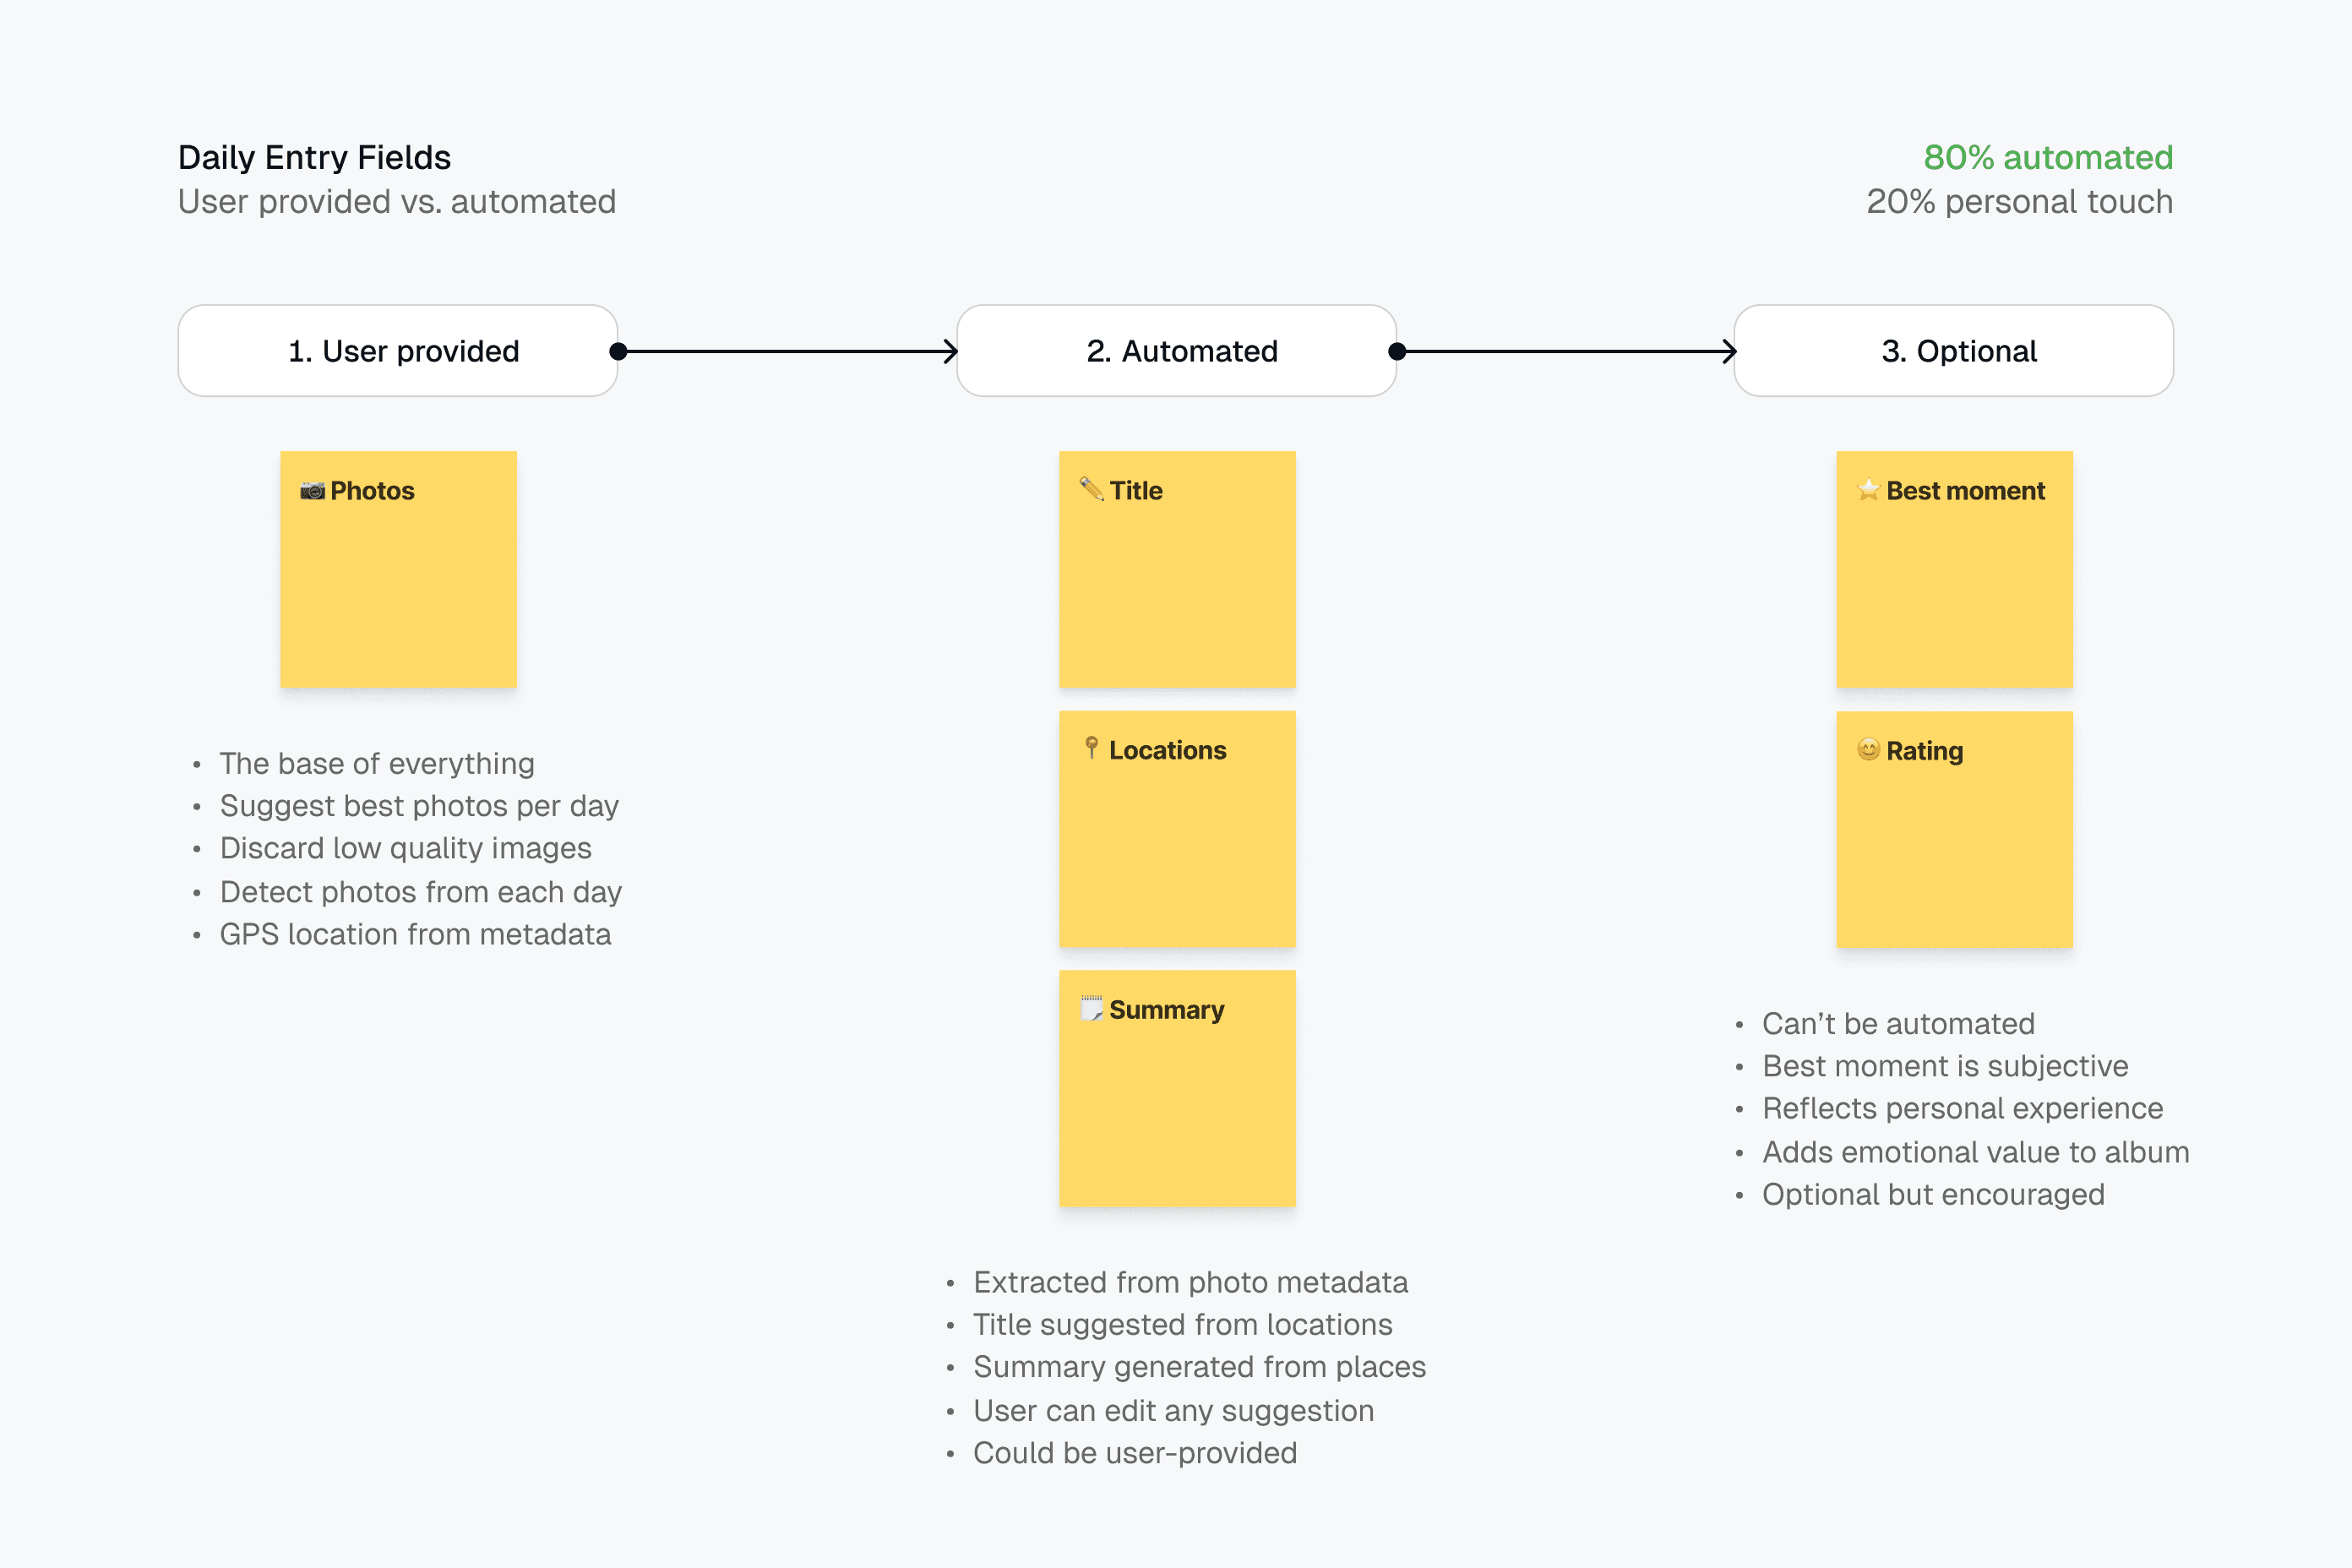
With a clearer picture of the problem, we had the intuition that improving the daily entry form could be a first step toward solving it. We analyzed every field separately and evaluated which ones could be automated or simplified. We explored solutions like AI or automation, but at that time these technologies were too new and still limited, so we needed to find a way to make the form more dynamic without development resources.

Field insights
Learning 01

Photos are the only required input. Everything else can be automated or is optional, potentially reducing the effort.

Learning 01

Photos are the only required input. Everything else can be automated or is optional, potentially reducing the effort.

Learning 01

Photos are the only required input. Everything else can be automated or is optional, potentially reducing the effort.

Learning 02

Personal fields like best moment and rating can't be automated, but they're quick to fill and add emotional value to the album.

Learning 02

Personal fields like best moment and rating can't be automated, but they're quick to fill and add emotional value to the album.

Learning 02

Personal fields like best moment and rating can't be automated, but they're quick to fill and add emotional value to the album.

Design decision 03

Proving the heart of the concept

To validate our direction, we found an analogous tool similar to Typeform where users would upload their information and we would handle the rest manually, simulating the experience of reduced user effort. The results confirmed our hypothesis: all participants completed their days mostly on time, proving that less responsibility leads to higher completion rates.

Hypothesis validation

Retrospective

The groundwork is done

The completion rate was a metric investors watched closely, and we had strong intuition about what was blocking users. This was my first real experiment with limited resources, and it showed me how much a designer can move forward without depending on a development team.

Then company priorities shifted, but the research, the validation, and the strategy will always be there. To measure success today, I would look at completion rate per trip, time spent documenting each day, and conversion from completed trips to tripbook purchases.

Impact

Completion rate per trip

Percentage of users who finish documenting all days.

Completion rate per trip

Percentage of users who finish documenting all days.

Completion rate per trip

Percentage of users who finish documenting all days.

Time spent per day

How long users take to complete each daily entry.

Time spent per day

How long users take to complete each daily entry.

Time spent per day

How long users take to complete each daily entry.

Trip-to-purchase rate

How many completed trips convert to tripbook purchases.

Trip-to-purchase rate

How many completed trips convert to tripbook purchases.

Trip-to-purchase rate

How many completed trips convert to tripbook purchases.

Create a free website with Framer, the website builder loved by startups, designers and agencies.